If Patti Had Existed Back Then: Three Ways to Turn Air into Bread
Patti Insight, Legends series. We take a piece of technology history everyone thinks they know and rebuild it as a Patti report: what could be seen at the time, what question should have been asked, and which signposts (signals that a route is starting to work) were worth watching. We already know how the story ends, so every section says plainly what was visible at the time and what is hindsight. At each handover between acts, we ask one question: if Patti had existed back then, what would have been different?
Each bracketed code such as 〔S01〕 corresponds to the "Source codes" appendix at the end. The verification status of the main factual sentences is kept in a separate record, available from the publisher on request.
Act 1 — The version you've heard
The usual telling goes like this: Fritz Haber invented ammonia synthesis, Carl Bosch turned it into a factory, and the world began making fertilizer out of thin air. We asked a general-purpose AI to write this history (below, "the AI-generated version"; it wrote in Chinese, and quotations are our translations), and it did a polished job. It called the Haber–Bosch process "the common ancestor of the modern high-pressure chemical industry and heterogeneous catalysis," put the global ammonia market at "USD 86.5 billion," and said the combined market value of the related industrial giants "has exceeded USD 600–800 billion."
It reads well. The trouble is that a reader can't tell which of those sentences will hold up.
Where that version doesn't add up
We checked the AI-generated version line by line against primary sources; the full table is available from the publisher on request. Six highlights:
| The AI-generated version says | Verdict | What we found |
|---|---|---|
| "common ancestor of … heterogeneous catalysis" | Wrong | In his own Nobel lecture, Haber compared Bosch's difficulties to those his predecessor Knietsch had overcome with the sulfuric-acid contact process 〔S01〕 — an earlier industrial catalytic process. |
| "USD 86.5 billion market, passing USD 121 billion by 2034" | Disputed | USD 86.5 billion is close to one research firm's 2025 estimate of USD 86.9 billion 〔S21〕. The USD 121 billion figure appears only on reposted pages; we could not read the original report 〔S22〕〔S30〕. Published 2034 forecasts range from roughly USD 116 billion to USD 154 billion (seen only in search excerpts, not read page by page) 〔S22〕. |
| "annual output of about 197 million tonnes" | Disputed (basis not stated) | The U.S. Geological Survey estimates 2025 world ammonia production at 160,000 thousand metric tons of contained nitrogen 〔S17〕. Converted to ammonia, that is in the low 190s of millions of tonnes — right order of magnitude, but the AI-generated version never says which basis it used. |
| "combined market value of USD 600–800 billion" | Attribution that can't be verified | This adds up the entire market capitalization of the giants it names (eight of them with individual figures) and calls it the "offspring" of one process. Those companies do many other things, and their valuations move daily. We don't do this kind of sum. |
| "Yara once tried the arc process before switching entirely to Haber–Bosch" | Needs correction | The arc process was run by Norsk Hydro, and not just as a trial: by 1905 its Notodden plants were producing nitric acid and calcium nitrate 〔S11〕. In spring 1927 Hydro partnered with Germany's I.G. Farben so that its calcium nitrate plants at Rjukan could expand by the "ammonia method" 〔S12〕. Yara was spun off from Hydro only in 2004 〔S13〕. |
| Bosch's "double-layer alloy" hydrogen-resistant reactor | Partly right | Bosch's lecture does describe an inner liner inside a steel jacket, later with degassing channels, to resist hydrogen attack on steel 〔S02〕 — but he does not call it an "alloy." |
The point isn't that the AI is bad. Its outline is mostly right. What goes wrong is where the numbers come from and how credit gets assigned — and a reader has no way to tell which lines to trust.
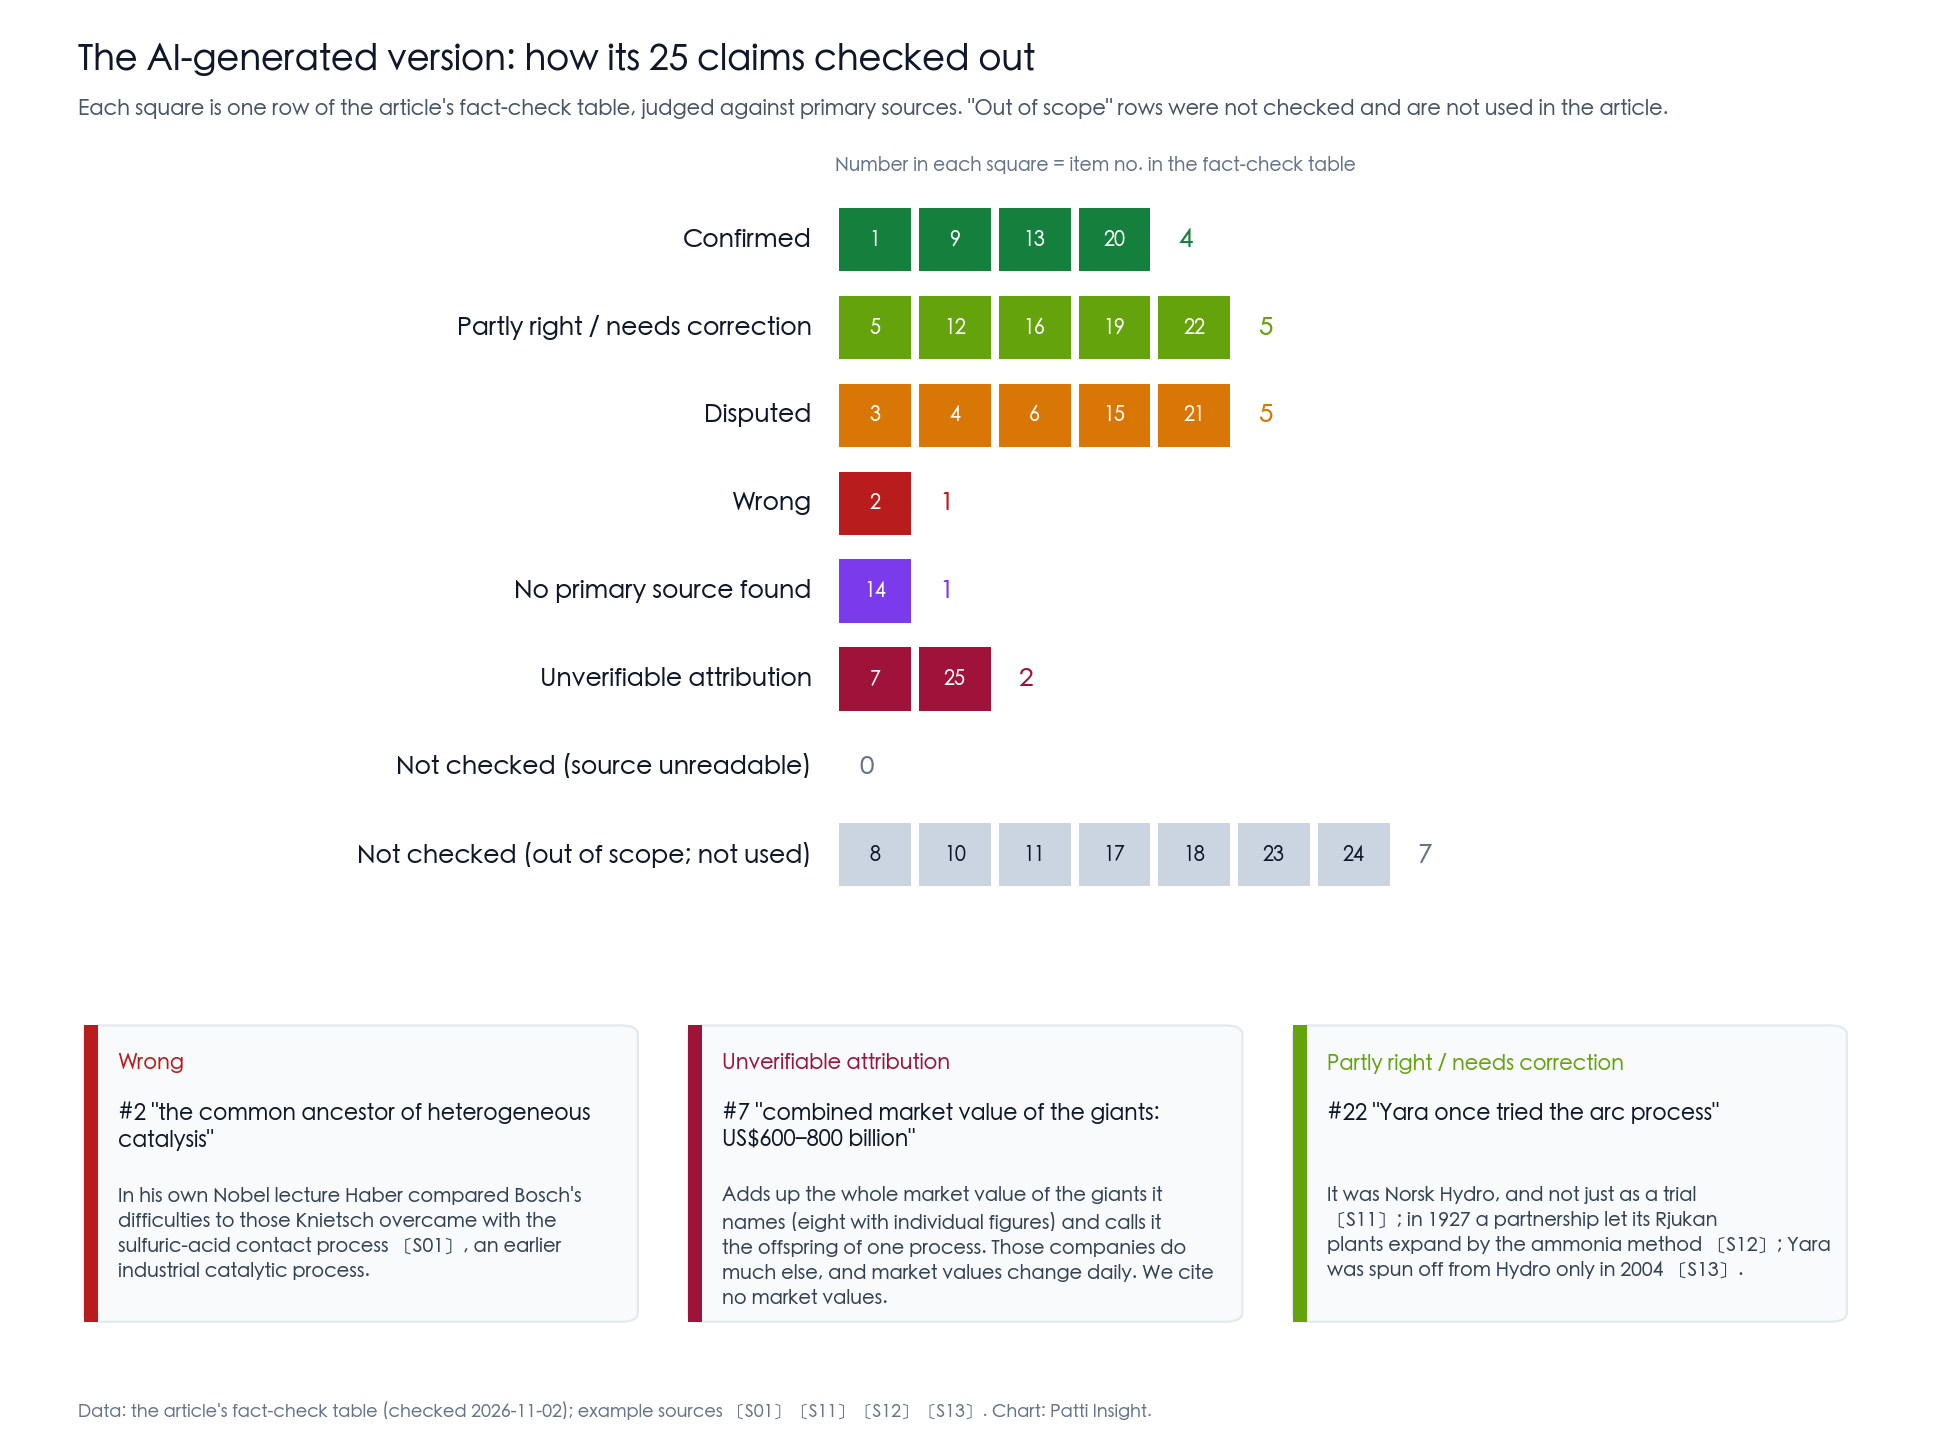
Figure: The 25 rows of the fact-check table, grouped by verdict. Confirmed 4; partly right or needing correction 5; disputed 5; wrong 1; no primary source found 1; unverifiable attribution 2. Another 7 rows fall outside this article's scope: we did not check them and do not use them. Sources for the three examples at the bottom of the figure are given in the table above 〔S01〕〔S11〕〔S12〕〔S13〕.
Act 2 — How someone back then would have asked
Set the clock to 1910 and imagine you run engineering at a mid-sized German manufacturer. You have read Crookes's warning that Chile's nitrate will run out. The Norwegians are burning air in electric arcs; another camp is soaking up nitrogen with calcium carbide. Your CEO asks: should we get in?
Most people would ask it like this:
The typical question: "What are the development trends in artificial nitrogen fixation?"
That gets you an encyclopedia entry — three methods, how each works, which looks promising. You still don't know whether to invest.
If Patti had been available in 1910, it would first restate your question back to you, and ask it like this instead:
The question after Patti's restatement: "We make pressure-rated steel and compressors in Germany (say where you sit). We need to decide whether to commit to materials and components for nitrogen-fixation plants over the next three years (say what decision you're making). For each of the three routes, what physical or cost limit is it stuck on (ask about the bottleneck, not the trend)? What signals would show that one route is starting to win (ask for signposts, not predictions)? Use only information public before 1910."
(Illustration. The actual restatement screen keeps your original question word for word, then lists the aspects Patti suggests adding for you to tick.)
Four things change: where you sit, the decision, the bottleneck, the signposts. The report heads somewhere completely different. A steelmaker cares about one thing: which route needs what I make, and when does that route clear its hurdle?
If Patti had existed back then ①: ask differently, get a different report
The typical question Asked the Patti way What it asks about Trends Bottlenecks and signposts The report you get An encyclopedia entry: three methods, how each works, which looks promising A signpost table: where each route is stuck, and which signals mean it is starting to win What you can do after reading Still not sure whether to invest Know which signals to watch, and move when you see them For you, the steelmaker Chemistry that has nothing to do with you Which route needs what you make Act 3 is the report you get when you ask the Patti way.
Act 3 — The 1910 Patti report (data cutoff: 1910)
The following was rebuilt by hand by the authors along these lines; it is not output from a real Patti run. The data keeps to the cutoff, but which documents we picked and which signposts we set are shaped by hindsight.
Everything below uses only information that was public or observable by the end of 1910. A one-page version appears as the figure at the end of this act.
The problem. In 1898, Sir William Crookes, president of the British Association, warned that the world's wheat supply would fall short and declared that "it is the chemist who must come to the rescue" 〔S03〕. His figures: Chilean nitrate exports of about 1.2 million tons a year 〔S03〕, with cautious local estimates that the raw ore would be exhausted in twenty to thirty years at that rate 〔S03〕. Limited supply, rising demand.
The bottleneck. Nitrogen in the air is unlimited, but it barely reacts with anything. Each of the three routes pays a different price to make it react.
Route 1: The electric arc (Norway, Birkeland–Eyde). Birkeland's arc patent application is dated February 20, 1903 (filing date), Norwegian patent announcement no. 12961 〔S10〕. The French patent for the same invention, FR 335,692, was published on February 5, 1904, in the names of Eyde and Birkeland, claiming Norwegian priority of February 20, 1903; Birkeland's U.S. patent US 772,862, "Process of electrically treating gases," was issued on October 18, 1904 〔S41〕. Notodden was chosen as the plant site in 1904 〔S13〕; Norsk Hydro was incorporated on December 2, 1905, by which time the Notodden plants were producing nitric acid and calcium nitrate 〔S11〕. The arc process's price is electricity. Working from laboratory data, Crookes estimated about 14,000 units (kWh) per ton of sodium nitrate 〔S03〕; he also noted that at Niagara Falls hydropower rates, "electric nitrate" already compared favorably with Chilean nitrate 〔S03〕. - Signposts (set by the authors): Does nitrogen fixed per kWh improve? Does equally cheap hydropower appear outside Norway? - Threshold (set by the authors): Nitrogen fixed per kWh at least double Crookes's estimate (that is, power use below about half of his 14,000 kWh per ton of sodium nitrate); observation window three years.
Route 2: Calcium cyanamide (Germany, Frank–Caro). A process for making cyanogen compounds from carbides was patented on March 31, 1895 (per company history; the source doesn't say whether that is the filing or grant date) 〔S14〕. In 1901 Albert Frank and Hermann Freudenberg proposed calcium cyanamide as a fertilizer under the name Kalkstickstoff 〔S14〕. The first full-scale plants opened in 1905 at Piano d'Orta (Italy) and Westeregeln (Germany) 〔S20〕; in 1908 Bayerische Stickstoff-Werke was founded to produce calcium cyanamide at Trostberg, Germany 〔S14〕; and the Odda plant in Norway had 12,000 tons of annual capacity from 1909 〔S20〕. The cyanamide route's price is calcium carbide, which is made by heating lime and coal in an electric arc 〔S01〕. - Signposts (set by the authors): The power cost of carbide; whether farmers accept the new fertilizer. - Threshold (set by the authors): Delivered price per unit of nitrogen no higher than Chilean nitrate; observation window three years.
Route 3: High-pressure catalytic ammonia synthesis (Haber's lab; rights held by BASF). On September 27, 1910, the U.S. granted Haber and Le Rossignol's patent US 971,501, assigned to BASF. Claim 1 reads: "The process of producing ammonia by passing gases containing nitrogen and hydrogen over a catalyst containing osmium" 〔S06〕. French patent FR 418,287 was published on December 5, 1910, in BASF's name 〔S07〕. In other words, by the end of 1910 a reader of patent gazettes could see that BASF held the U.S. patent by assignment and had applied for the French one, and that Claim 1 of the U.S. patent used an osmium catalyst. "BASF bet on this route" is our reading. - Signposts (set by the authors): A catalyst cheaper and more plentiful than osmium; reactors that survive long runs in hot, high-pressure hydrogen; cheap hydrogen at scale. - Threshold (set by the authors): Patents on catalysts built from common metals; a plant publicly reporting more than a year of continuous operation; observation window five years.
Patent activity at the time. All three routes were patented, and early: Frank–Caro in 1895, Birkeland in 1903, the ammonia-synthesis route's U.S. and French patents made public in 1910. What a reader could do in 1910 was read the national patent gazettes; this section can only be written in words, not drawn as a full filing-trend chart.
What it means for you. If you can't take on a whole route yourself, prepare the piece you're good at: pressure-rated steel, compressors, catalysts, electrical equipment. Routes 1 and 2 need huge amounts of power; Route 3 needs high-pressure equipment and catalysts. Where you sit decides which signposts you should be watching.
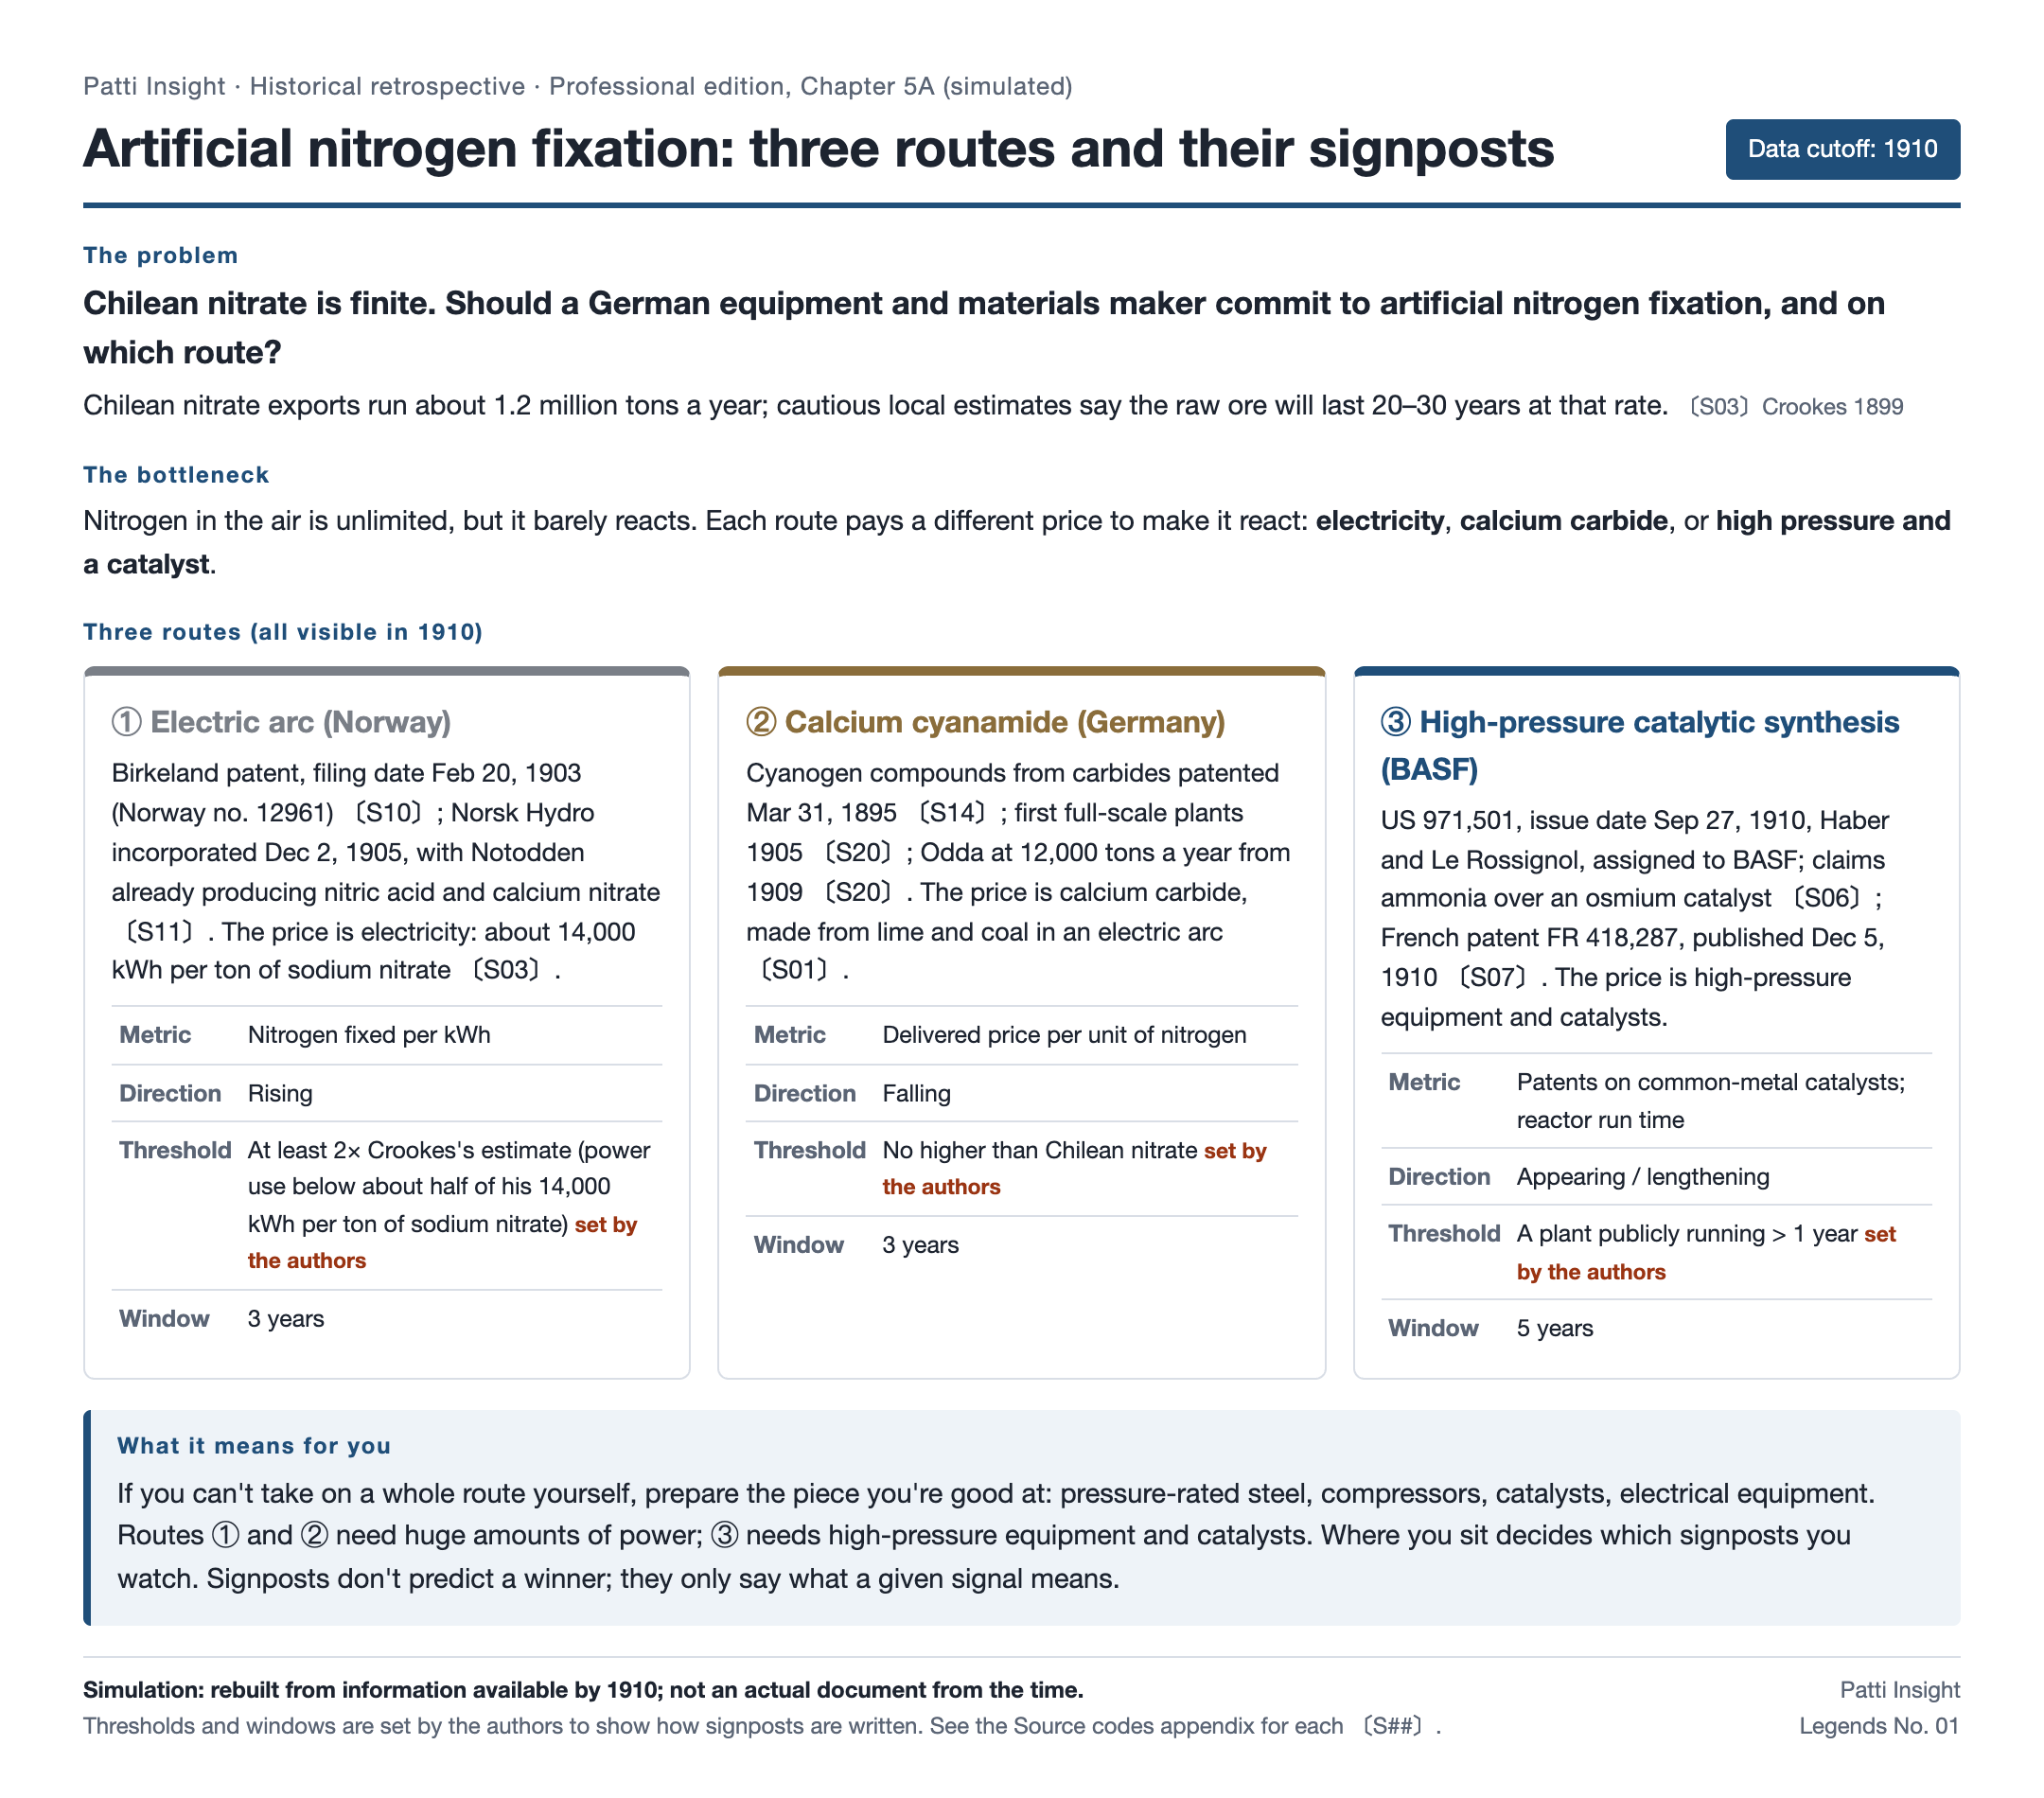
Figure: The one-page version of Act 3, rebuilt only from information public by the end of 1910 〔S01〕〔S03〕〔S06〕〔S07〕〔S10〕〔S11〕〔S14〕〔S20〕. It is a simulation, not an actual document from the time; thresholds and observation periods are our own.
If Patti had existed back then ②: which light comes on first?
At the end of 1910, these signposts are what you hold (the one-page version is above): catalyst, reactor, hydrogen, power price, whether farmers accept the product. Over the next few years, which signal shows up first? Which route gets stuck first? Make your guess, then turn to Act 4.
Act 4 — The reveal (hindsight)
Everything in this section was learned after the fact. A 1910 reader couldn't see it. We show it so you can compare it with the signposts in Act 3.
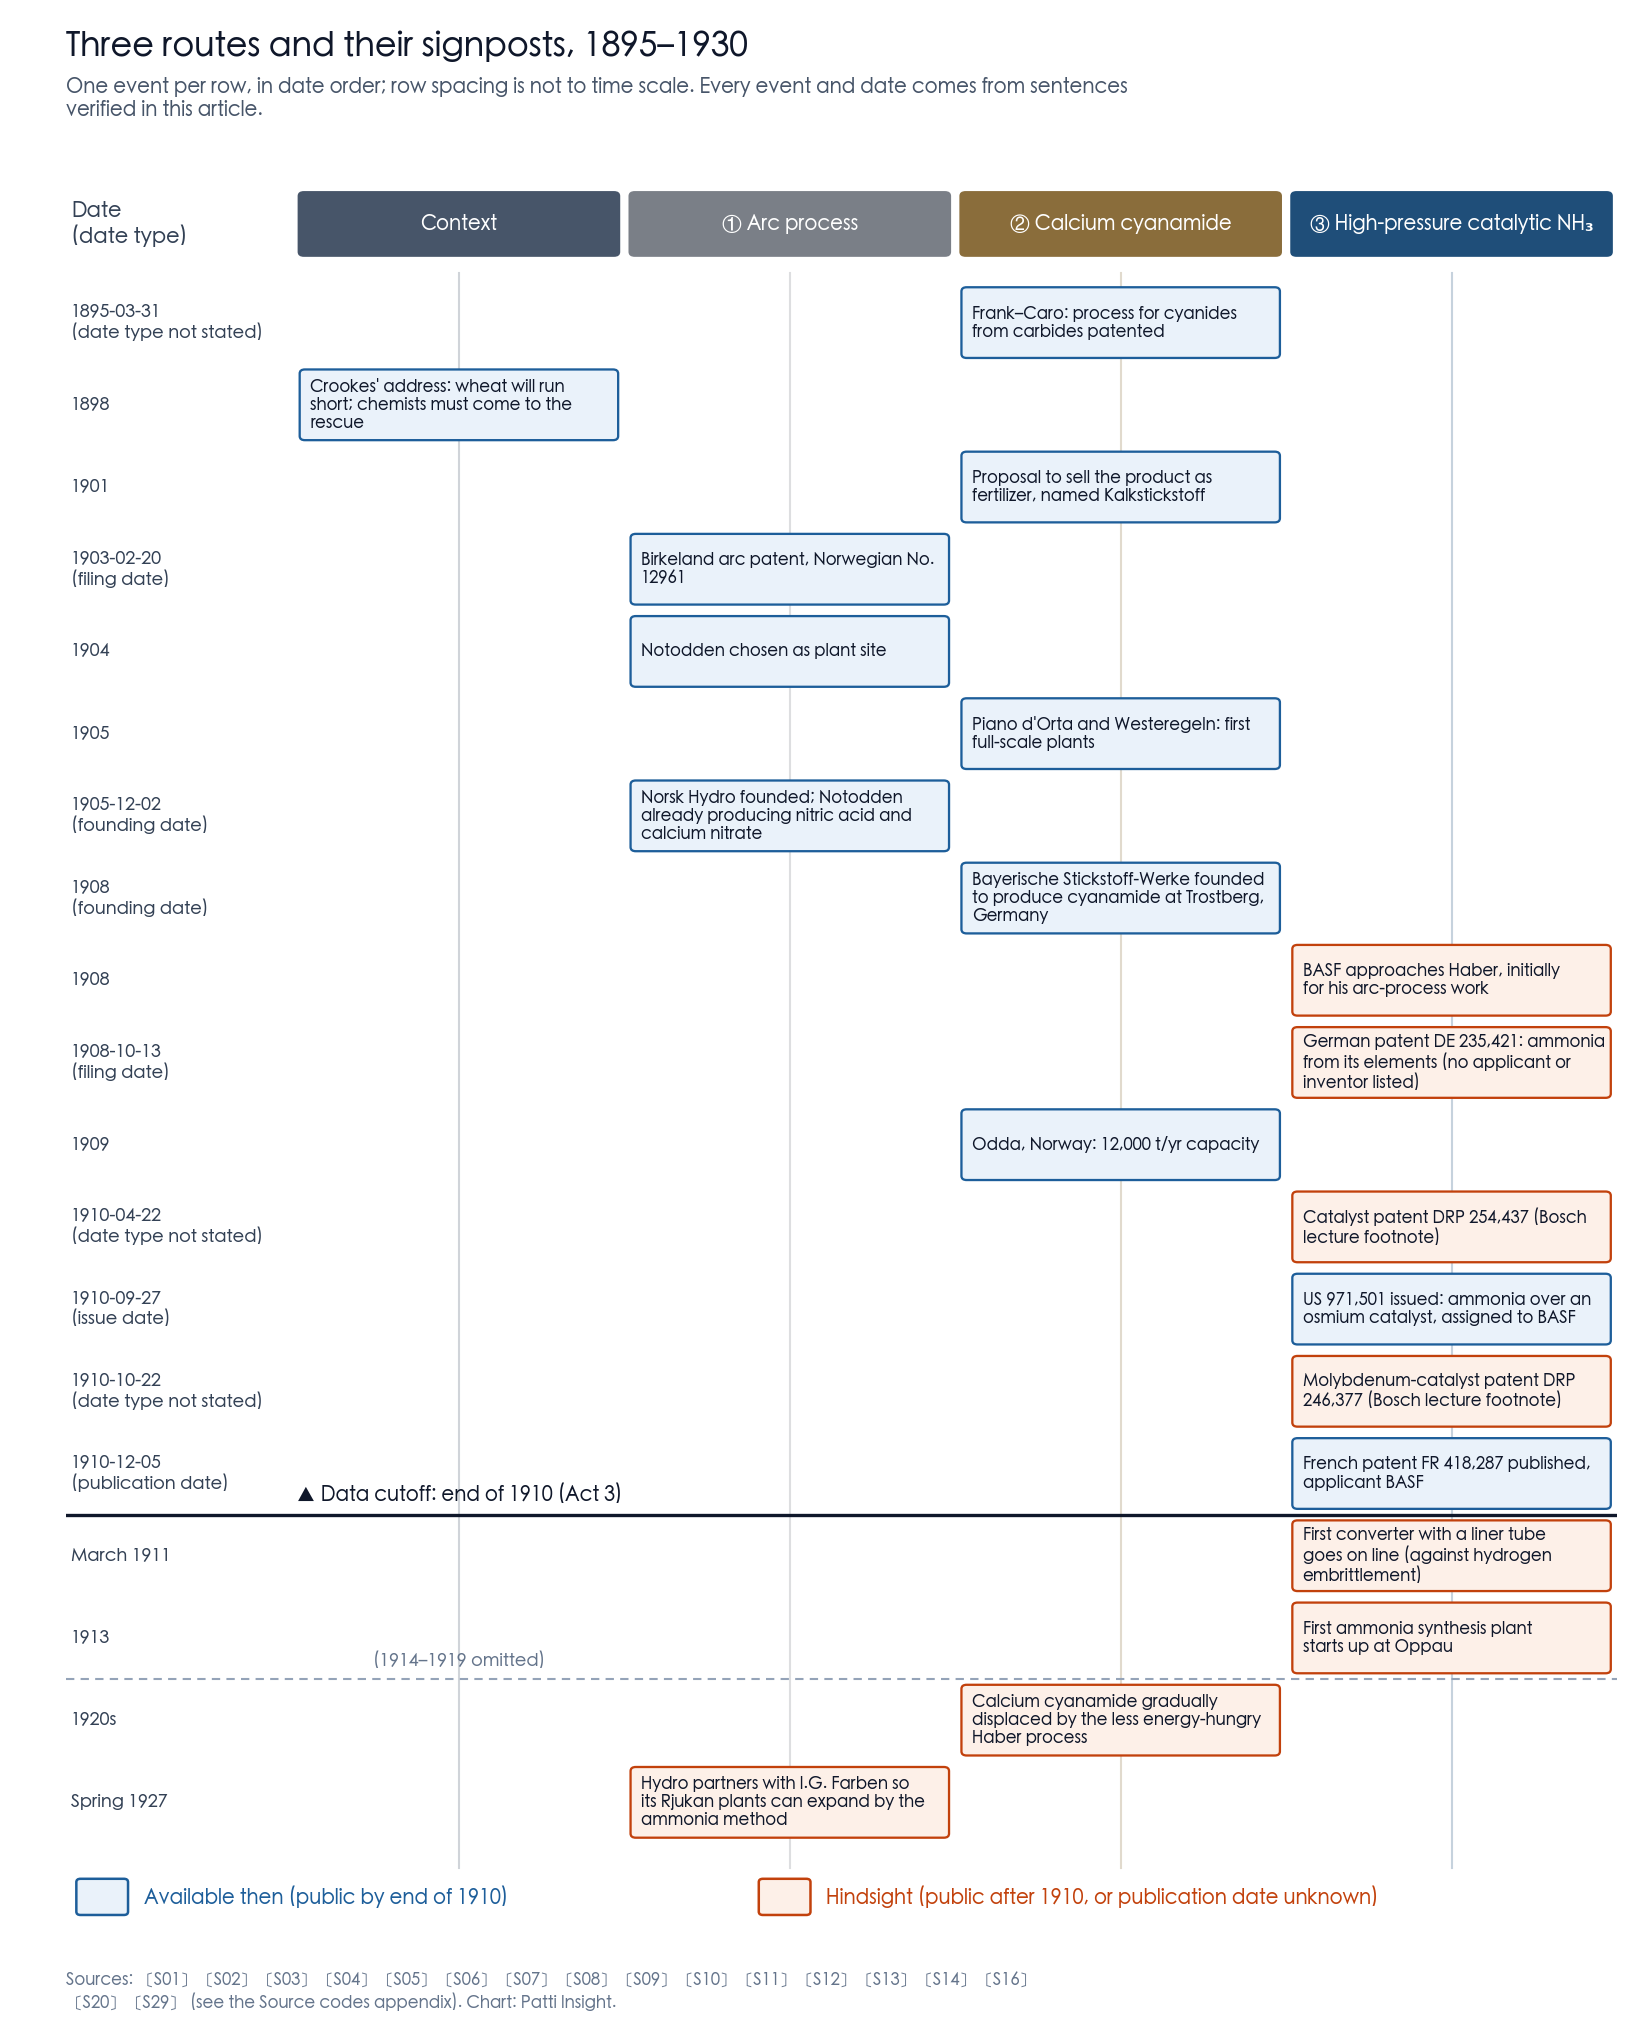
Figure: Key events on the three routes, in date order; row spacing is not to time scale. Blue boxes were public by the end of 1910 and readable at the time; orange boxes are hindsight — made public after 1910, or with no known publication date. The bracket after each date gives its type (filing, issue, publication or founding date); where the original source does not say, we mark it as not stated. Haber's laboratory demonstration and the First World War blockade were not verified sentence by sentence in this article, so they are not drawn 〔S01〕〔S02〕〔S03〕〔S04〕〔S05〕〔S06〕〔S07〕〔S08〕〔S09〕〔S10〕〔S11〕〔S12〕〔S13〕〔S14〕〔S16〕〔S20〕〔S29〕.
Which signpost appeared first? By the dates we found, the catalyst. In his 1932 Nobel lecture, Bosch said the world's entire supply of osmium amounted to only a few kilograms 〔S02〕; BASF ran a cumulative 20,000 tests and arrived at mixed catalysts built mainly on iron 〔S02〕. Bosch's footnotes cite several catalyst patents dated 1910, such as DRP 254,437 (April 22, 1910) and DRP 246,377 (October 22, 1910, molybdenum); the lecture doesn't say which kind of date these are 〔S02〕〔S08〕.
The reactor almost didn't make it. Two tubes drawn by Mannesmann each lasted 80 hours before bursting; using metallography, Bosch found that hydrogen had penetrated the steel and embrittled it 〔S02〕. In March 1911 the first converter with an inner liner went into service 〔S02〕. In 1913 the first ammonia synthesis plant began operating at Oppau 〔S16〕. The lab's key features — about 200 atmospheres, 500–600 °C, circulation under constant high pressure, and heat exchange from exit gas to feed gas — all carried over into industrial practice 〔S01〕.
Who read it right? BASF — but not at first. Haber said in his 1920 Nobel lecture that BASF approached him in 1908 mainly because it valued his work on improving the arc process; it backed high-pressure ammonia synthesis "only with hesitation" 〔S01〕. Before that, BASF had been pursuing an indirect route through nitrides of aluminum, silicon and titanium 〔S01〕. German patent DE 235,421 has a filing date of October 13, 1908 (the bibliographic records list no applicant or inventor), and its claim opens with Verfahren zur synthetischen Darstellung von Ammoniak aus den Elementen (a process for the synthetic production of ammonia from the elements) 〔S04〕〔S05〕.
Who missed it? According to Haber in 1920, the French chemist Le Chatelier had already considered the effects of temperature and pressure by 1901, but after early failures he dropped the work and published his thinking only in a French patent filed under a foreign name (we did not check that patent) 〔S01〕. He had the idea; he didn't keep watching his own signposts.
What happened to the other two routes? Haber noted in 1920 that the arc process converted no more than 16 grams of nitrogen into nitric acid per kWh, against a theoretical figure 30 times higher 〔S01〕. Hydro's engineers had seen the electric arc as "the very soul of the company" 〔S12〕, but in spring 1927 Hydro chose to partner with I.G. Farben so that its calcium nitrate plants at Rjukan could expand by the "ammonia method" 〔S12〕. Calcium cyanamide was gradually displaced by the more energy-efficient Haber process during the 1920s 〔S20〕.
Haber received the 1918 Nobel Prize in Chemistry for ammonia synthesis (lecture delivered 1920); Bosch received the 1931 prize 〔S01〕〔S02〕.
Looking back at Act 3: The signposts never predicted a winner. They only said "if you see this, it means that." The catalyst patents in Bosch's footnotes carry 1910 dates (date type not stated); we did not check whether they were public at the time. A converter with an inner liner appeared in 1911, and Oppau began operating in 1913; we found no record meeting the Act 3 threshold (a plant publicly reporting more than a year of continuous operation). A 1910 reader who checked those signals regularly would at least have known where to look. That is a test of method — we are not claiming anyone could have called it in 1910.
If you had Patti today ③: can a losing route come back?
Act 4 looks like an ending: ammonia synthesis won; the arc and cyanamide routes were out. But a signpost only says where a route is stuck, not that it is stuck forever. The arc process was stuck on power use and the price of power. What if the power-price signpost moves one day?
Interlude — When history can reverse (hindsight)
Everything in this section is hindsight.
A losing route is not a losing company. The arc process lost, yet Norsk Hydro did not go down with it: in spring 1927 it partnered with I.G. Farben so that its calcium nitrate plants at Rjukan could expand by the "ammonia method" 〔S12〕.
Which signpost did the arc process fail? Electricity. In 1898 Crookes estimated about 14,000 units (kWh) per ton of sodium nitrate 〔S03〕; in 1920 Haber noted that each kWh fixed no more than 16 grams of nitrogen 〔S01〕. Both figures show that the arc process used a great deal of electricity.
Today, the power-price signpost shows signs of loosening. The Act 3 signposts were nitrogen fixed per kWh and cheap hydropower; here we look at the cost of electricity, using solar generation cost as a stand-in, not retail power prices. According to the International Renewable Energy Agency, the global weighted-average cost of electricity from utility-scale solar fell from USD 0.417/kWh in 2010 to USD 0.043/kWh in 2024, a 90% drop (2024 dollars) 〔S35〕. Lawrence Berkeley National Laboratory data point the same way, and also show that a signpost can move back: the cost of U.S. utility-scale solar (without tax credits, 2025 dollars) fell from about USD 254/MWh in 2010 to about USD 49/MWh in 2022, then rose to about USD 61/MWh in 2025 (preliminary) 〔S36〕. "Fixing nitrogen with electricity" has come back in a new form — not the arc, but green ammonia made with renewable hydrogen, and direct electrochemical synthesis. Ammonia production itself uses a lot of energy: the International Energy Agency estimates that ammonia production accounts for about 2% of total final energy consumption and 1.3% of CO2 emissions from the energy system 〔S25〕. In patent activity, green / electrochemical ammonia had 1,400 families in 2020–26, 968 of them filed only in China 〔S31〕.
Market figures and patent counts sit side by side; neither substitutes for the other. World ammonia production was an estimated 160,000 thousand metric tons (nitrogen content) in 2025 〔S17〕. For green ammonia itself, the project database we found is licensed for non-commercial use only, so we don't cite it 〔S34〕. Patent families tell you how many people are placing bets; production and use tell you how big the market already is. 1,400 families do not mean green ammonia already has a market.
For engineers today: what matters isn't being in the mainstream. It's reading the signposts and knowing when to turn. In 1927 Hydro decided to partner with I.G. Farben so that its calcium nitrate plants at Rjukan could expand by the "ammonia method." The fall in solar generation cost and the rise in "fixing nitrogen with electricity" patent families happened over the same period; we did not investigate whether one caused the other.
If Patti had existed in 1908 ④: what does one patent grow into?
When DE 235,421 was filed in 1908, no one could see what it would look like a century later; only hindsight can draw such a chart. Act 5 draws it. When you've seen it, ask yourself: what will the patent in your hands grow into?
Act 5 — The descendants
Here is the core function of Haber–Bosch, written as one general sentence:
Under high pressure and in a loop, use an inexpensive catalyst to turn two gases that won't normally react into a compound you can store and ship.
Starting from that sentence, our first idea was a citation tree: begin with the 1908 German patent DE 235,421 and follow who cited it. It can't be built. In Google Patents data, DE 235,421 is cited by only 2 documents, both from 2024 or later 〔S31〕. Hundred-year-old patents predate modern citation practice, so a citation tree would miss the whole lineage. Today's bibliographic databases are also thin for the 1900s: the European Patent Office's service has no record of Norwegian no. 12961 〔S29〕; for DE 235,421 it returns a filing date, classification code and family, with title and applicant blank 〔S04〕; for the other German patents it returns only a classification code 〔S08〕〔S09〕. Instead we used a classification lineage: using patent classification (CPC), we counted patent families in each descendant branch, decade by decade.
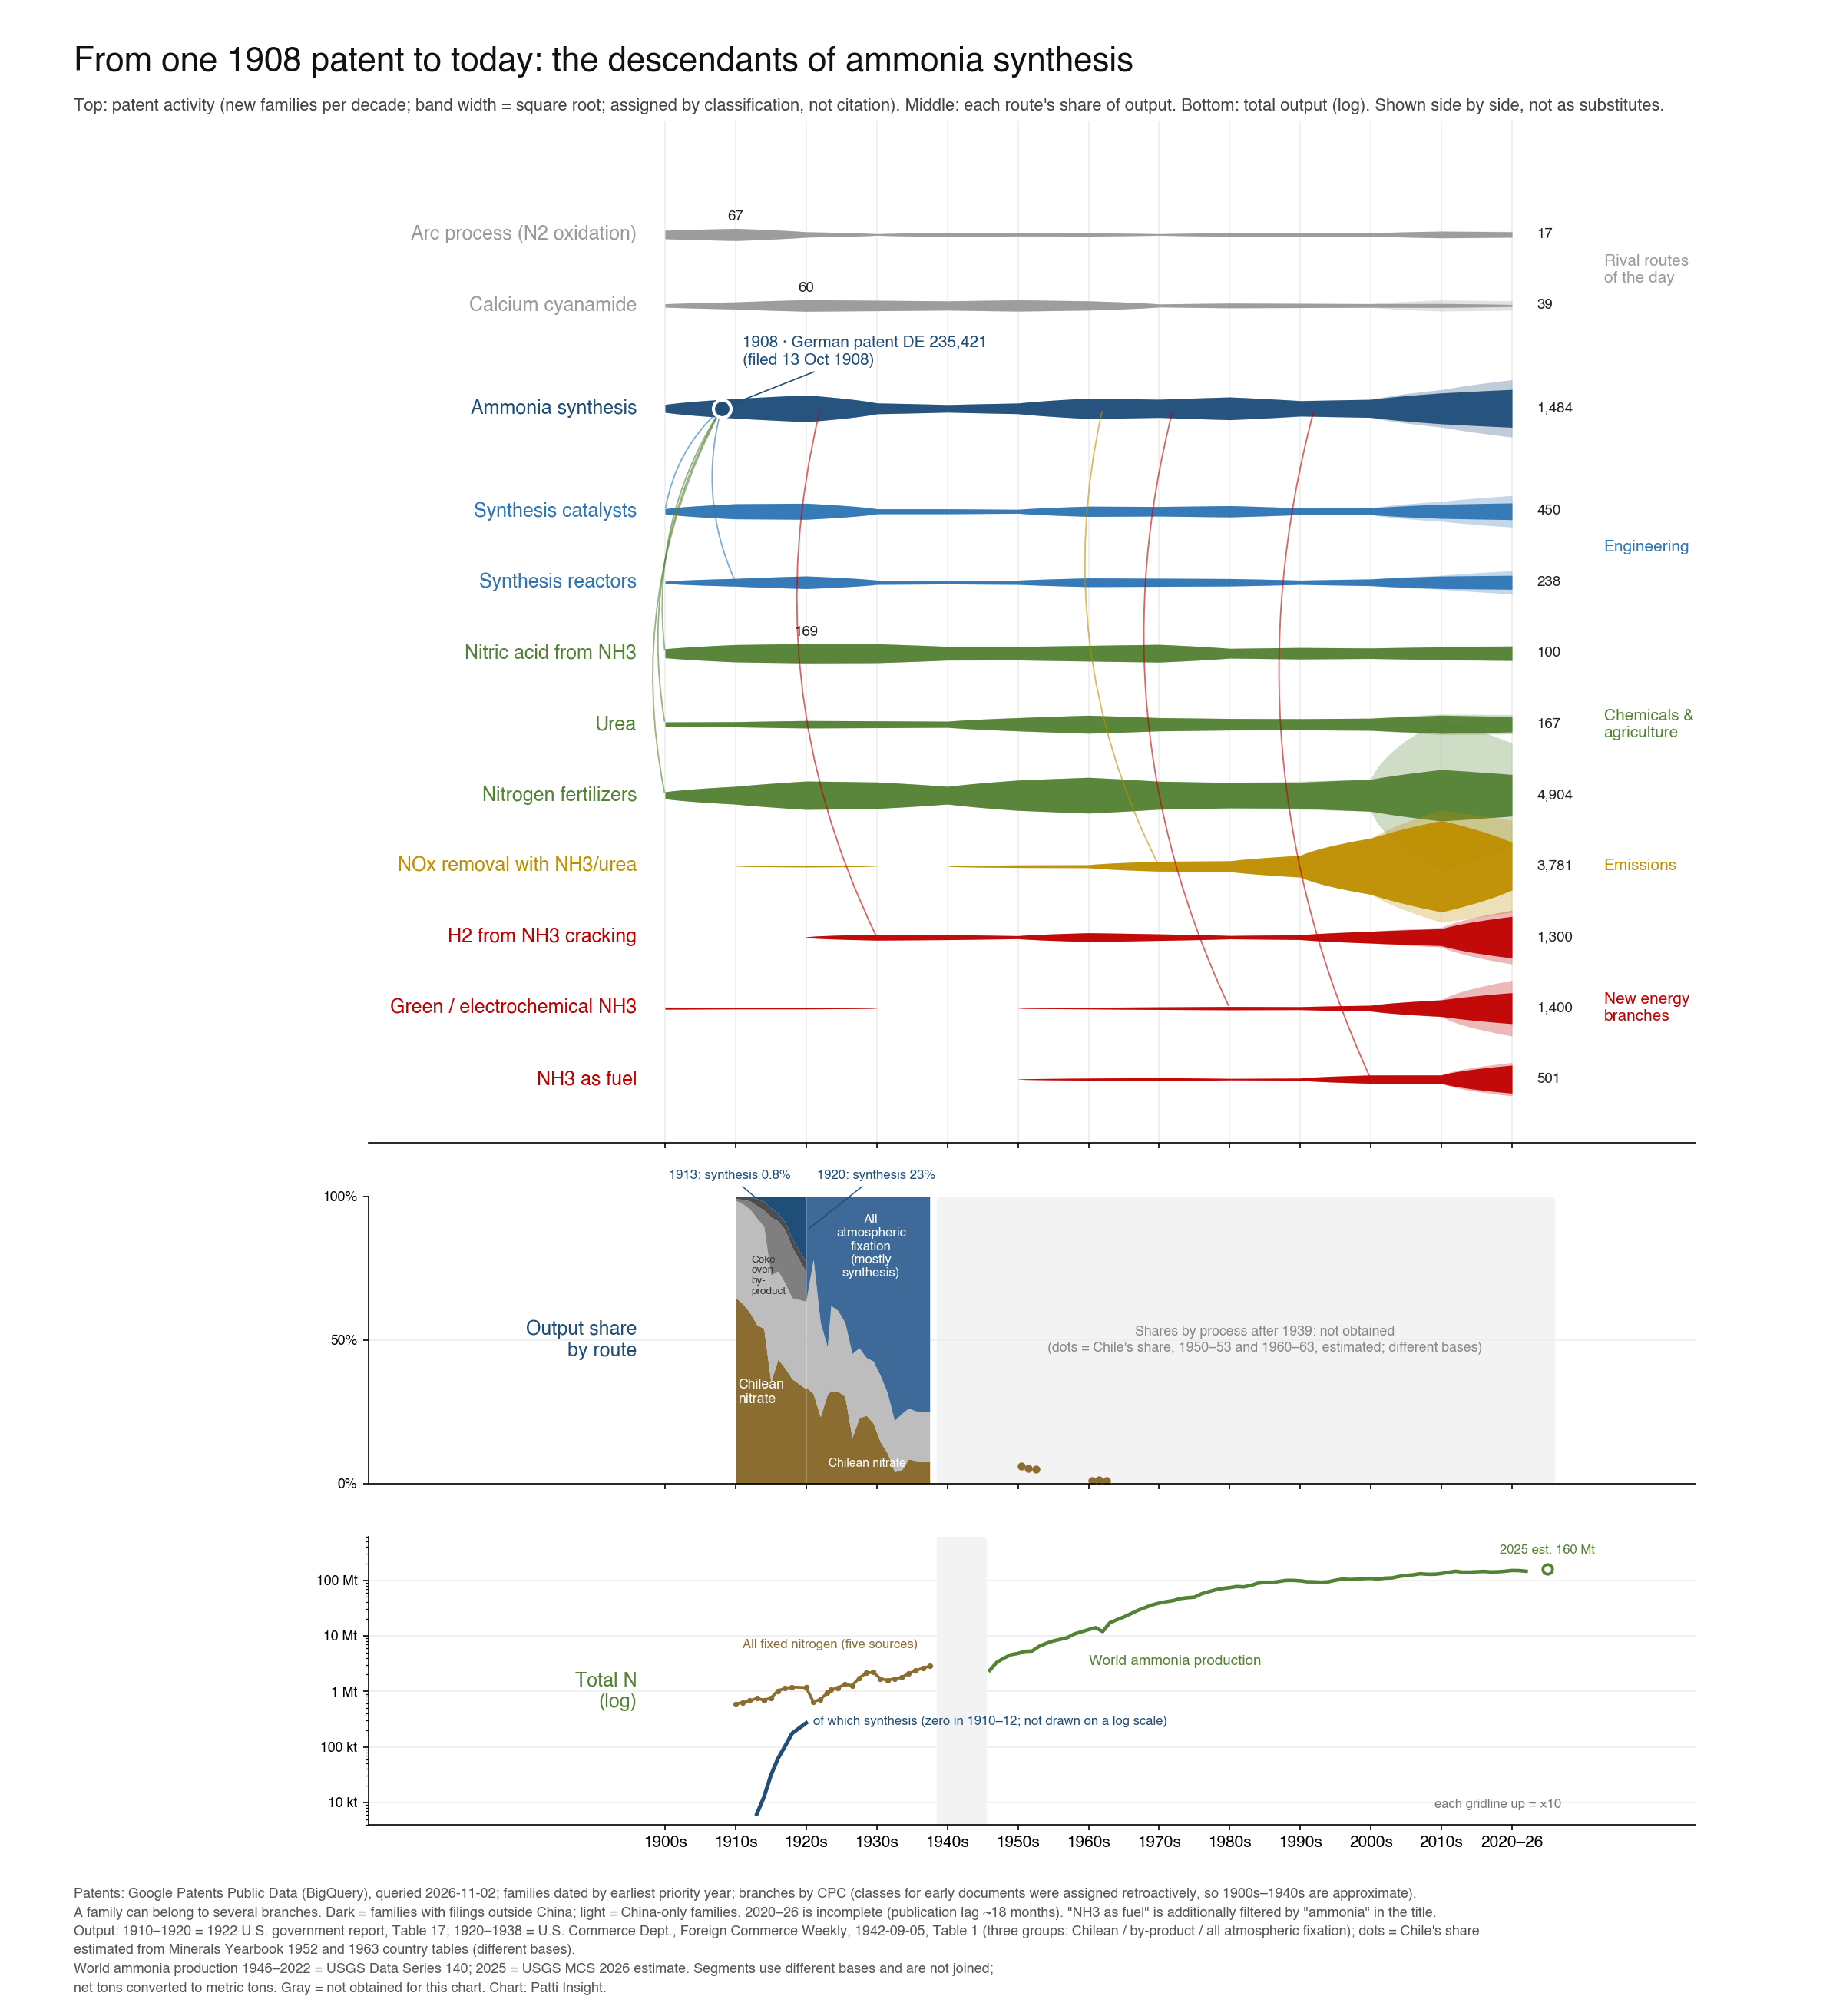
Figure: Of the three routes in 1910, only one grew into a forest. The two thin gray bands at the top are the arc process and calcium cyanamide, with just 17 and 39 new families in 2020–26; the ammonia-synthesis trunk alone has 1,484, and below it branch catalysts, reactors, chemicals, emissions control and energy 〔S31〕. Band width is the square root of new patent families per decade, binned by each family's earliest priority date 〔S31〕. Branches are assigned by patent classification — not by citation; the connecting lines from the trunk only mark the decade in which each branch first reached 5 families, and are not citations either. The subject is patent activity, not market size. Classifications on early documents were added retroactively, so the 1900s–1940s are approximate; filings from 2020–26 are not yet fully published.
*The chart has three layers. From top to bottom they are patent activity, each route's share of output, and total output; they are shown side by side, and none substitutes for another. The share layer shows how each route's output changed: synthetic ammonia was only 0.8% of all nitrogen produced in 1913, and 23% in 1920 〔S38〕. In 1913 the Haber process produced 6,798 net tons of nitrogen, the smallest of the five nitrogen sources in the original table; calcium cyanamide at 35,838 and the arc and other processes at 19,800 were both larger 〔S38〕. In 1920 the Haber process produced 297,000 net tons, more than calcium cyanamide at 130,000 (marked as an estimate in the original table) and the arc and other processes at 42,130 〔S38〕. The report itself cautions that a large part of the increased war production came from plants "not capable of economic commercial production" 〔S38〕. Chilean nitrate's share fell from 33.6% in 1920 to 4.2% in 1932/33 〔S39〕. It was roughly 5–6% in 1950–53 and roughly 1.1–1.2% in 1960–63; both are estimates based on Chile's national nitrogen output, and the two periods are measured on different bases 〔S40〕. We have no by-process shares after 1939, and no totals for 1900–1909 or 1939–1945. The total layer uses a logarithmic scale: each gridline up is ×10. World ammonia production was 2.38 million metric tons in 1946 and 145 million metric tons in 2022, nitrogen content 〔S37〕; the 2025 estimate is 160 million metric tons 〔S17〕. For 1910–1920 the original unit is net (short) tons, converted to metric tons in the chart; 1919 is missing from the original table; the 1917 cyanamide and Haber cells are illegible in print and were back-calculated from the totals 〔S38〕. *
Act 3 and Act 4, seen as patent activity. Arc-process nitrogen fixation had 67 patent families in the 1910s and 13 in the 1920s 〔S31〕. Calcium cyanamide had 60 in the 1920s 〔S31〕. Ammonia synthesis grew from 173 families in the 1910s to 322 in the 1920s 〔S31〕. That lines up with the history in Act 4 — but these are patent counts, not output, and not a measure of who made money.
The branches.
- Fertilizer and nitrogen chemicals. According to the U.S. Geological Survey, about 88% of U.S. ammonia goes to fertilizer; the main derivatives, in descending order of output, are urea, ammonium nitrate, nitric acid, ammonium phosphates and ammonium sulfate 〔S17〕. The "nitrogen fertilizer" branch in the chart has 10,357 families in the 2010s, of which 9,167 were filed only in China 〔S31〕. That reflects Chinese filing behavior; it can't be read as a global trend.
- Other high-pressure chemistry. Bosch said in 1932 that BASF carried its high-pressure and catalyst know-how into methanol synthesis, urea production, and — after buying Bergius's patents — coal hydrogenation 〔S02〕.
- Semiconductors. Ammonia is the usual nitrogen source in metalorganic chemical vapor deposition of gallium nitride (GaN) 〔S19〕.
- New energy branches (2020–26). Hydrogen from ammonia cracking: 1,300 families, 519 of them filed only in China. Green / electrochemical ammonia: 1,400 families, 968 only in China. Ammonia as fuel: 501 〔S31〕. The first two had only 173 and 129 families in the 2010s 〔S31〕, so the jump is clear (2020–26 covers only seven years, and its data are still incomplete); but the China-only share is high, so it can't be read directly as a global trend. The AI-generated version calls green ammonia "the best chemical carrier" for shipping hydrogen across oceans. The International Energy Agency's 2021 Ammonia Technology Roadmap is more cautious: ammonia is easier to transport and store than pure hydrogen; 185 Mt were produced in 2020, about 20 Mt of it traded internationally, and almost 200 ports worldwide have ammonia terminals. But the IEA describes this as potential, not as an established use, and names toxicity and NOx and N2O emissions as the main hurdles 〔S25〕. "Best" is the AI-generated version's own word.
Derivative markets — not investigated here. We deliberately leave the market size of each branch below blank: patent-family counts show that people are placing bets, not how big that branch's market is.
| Branch (see chart above) | Derivative market |
|---|---|
| Nitric acid from NH₃ | Not investigated here |
| Urea | Not investigated here |
| Nitrogen fertilizers | Not investigated here |
| NOx removal with NH₃ (SCR) | Not investigated here |
| H₂ from NH₃ cracking | Not investigated here |
| Green / electrochemical NH₃ | Not investigated here |
| NH₃ as fuel | Not investigated here |
Industry scale, listed with named sources — not a causal attribution:
- World ammonia production: an estimated 160,000 thousand metric tons (nitrogen content) in 2025 〔S17〕.
- Global ammonia market: USD 86.9 billion in 2025, projected at USD 128.0 billion by 2034 (one research firm's estimate) 〔S21〕. Other firms' 2034 projections run from about USD 116 billion to USD 154 billion (seen only in search excerpts, not read page by page) 〔S22〕.
- Population supported by synthetic nitrogen fertilizer: estimates range from about 40% to about half of the world's people 〔S18〕. Those figures come from work by Smil and by Erisman and colleagues, which we could not read in the original 〔S23〕〔S24〕.
None of these numbers is credit owed to the Haber–Bosch process or to any single patent. Industries grow from a century of work by many thousands of people. The Act 5 chart answers only "where does this function reach?" — not "whose money is this?"
Closing: if you have a technical question of your own
The questions in this article can be reused: what could be seen at the time, what should have been asked, and which signposts were worth watching.
If you want Patti Insight to look at your own topic, there are two routes. Ready-made reports are on topics we chose, and you can buy them directly. A tailored study starts with an application: a person reviews your identity and topic first, we send a payment link only if the application is accepted, and research starts after payment. A topic may be declined, and a report may not answer everything you wanted to know. Where Patti hasn't read the full text, it won't judge whether a technical gap (a problem no one has solved yet) exists there.
This article did not investigate which branch your technology falls in, or how that branch is doing.
How Patti Insight works, and its limits: https://patti.empryon.ai/methods
Act 3 is a simulation: rebuilt by hand by the authors from what could be known before 1910. It is not a historical document, and not output from a real Patti run. All signpost thresholds were set by the authors to illustrate the method.
Ready-made reports
This article is a retrospective. For current technical questions, see the ready-made Patti Insight reports.
Source codes
Each code 〔S##〕 in the text corresponds to a line below. Every code used in this article is listed.
- 〔S01〕Fritz Haber | "The synthesis of ammonia from its elements," Nobel Lecture (1918 Prize in Chemistry), delivered June 2, 1920 | In Nobel Lectures, Chemistry 1901–1921 (Elsevier, 1966) | https://www.nobelprize.org/uploads/2018/06/haber-lecture.pdf | Primary source
- 〔S02〕Carl Bosch | "The development of the chemical high pressure method during the establishment of the new ammonia industry," Nobel Lecture (1931 Prize in Chemistry), delivered May 21, 1932 | https://www.nobelprize.org/uploads/2018/06/bosch-lecture.pdf | Primary source
- 〔S03〕Sir William Crookes | The Wheat Problem: based on remarks made in the presidential address to the British Association at Bristol in 1898, revised, with an answer to various critics | London: John Murray, 1899 | https://archive.org/details/wheatproblembase00croorich | Primary source
- 〔S04〕EPO Open Patent Services (OPS v3.2), bibliographic record for DE235421C | Queried November 2, 2026 | https://ops.epo.org/3.2/rest-services/published-data/publication/docdb/DE.235421.C/biblio | Primary source (patent bibliography)
- 〔S05〕Google Patents: DE235421C | https://patents.google.com/patent/DE235421C/de | Primary source (patent full text, OCR)
- 〔S06〕Google Patents: US971501A, "Production of ammonia." | https://patents.google.com/patent/US971501A/en | Primary source (patent full text)
- 〔S07〕EPO OPS bibliographic record for FR418287A | Queried November 2, 2026 | Primary source (patent bibliography)
- 〔S08〕EPO OPS bibliographic records for DE249447C, DE254437C, DE246377C, DE254571C (and family member DE256296C) | Queried November 2, 2026 | Primary source (patent bibliography)
- 〔S09〕EPO OPS bibliographic record for DE88363C | Queried November 2, 2026 | Primary source (patent bibliography)
- 〔S10〕Equinor (news archive; formerly Hydro's oil division) | "When the chemistry was right and the gun flashed" | February 6, 2003 | https://www.equinor.com/news/archive/2003/02/06/WhenTheChemistryWasRightAndTheGunFlashed | Primary source (company history; the company's own account)
- 〔S11〕Norsk Hydro company history | "1905 A new working day – 2 December 1905" | https://www.hydro.com/us/global/about-hydro/company-history/1900---1917/1905-a-new-working-day-2-december-1905/ | Primary source (company history; the company's own account)
- 〔S12〕Norsk Hydro company history | "1919 Research as driving force and inspiration" | https://www.hydro.com/us/global/about-hydro/company-history/1918---1928/1919-research-as-driving-force-and-inspiration/ | Primary source (company history; the company's own account)
- 〔S13〕Yara International | "The breakthrough that helped feed the world" | https://www.yara.com/knowledge-grows/the-breakthrough-that-helped-feed-the-world/ | Primary source (company history; the company's own account)
- 〔S14〕Evonik company history | "Co-founder of SKW – Nikodem Caro" | https://history.evonik.com/en/predecessor-companies/skw-trostberg/caro-nikodem | Primary source (company history; the company's own account)
- 〔S16〕BASF company chronology | "1913 – First ammonia synthesis plant" | https://www.basf.com/global/en/who-we-are/history/chronology/1902-1924/1913 | Primary source (company history; the company's own account)
- 〔S17〕U.S. Geological Survey | Mineral Commodity Summaries 2026: Nitrogen (Fixed)—Ammonia | 2026 | https://pubs.usgs.gov/periodicals/mcs2026/mcs2026-nitrogen.pdf | Primary source (government statistics)
- 〔S18〕Hannah Ritchie | "How many people does synthetic fertilizer feed?" | Our World in Data, November 7, 2017 (continually updated) | https://ourworldindata.org/how-many-people-does-synthetic-fertilizer-feed | Scholarly secondary source
- 〔S19〕Yuxuan Zhang, Zhaoying Chen, Kaitian Zhang, Zixuan Feng, Hongping Zhao | "Laser-Assisted Metalorganic Chemical Vapor Deposition of GaN" | arXiv:2104.01064, April 2, 2021 | https://arxiv.org/abs/2104.01064 | Scholarly (preprint)
- 〔S20〕Wikipedia | "Frank–Caro process" | Read November 2, 2026 | https://en.wikipedia.org/wiki/Frank%E2%80%93Caro_process | General media
- 〔S21〕IMARC Group | "Ammonia Market Size, Share, Trends and Forecast" (summary page) | Read November 2, 2026 | https://www.imarcgroup.com/global-ammonia-market | General media (market-research summary)
- 〔S22〕Market forecasts as reposted (attributed to Fortune Business Insights) | Reposts on dev.to, hackmd.io and similar sites, read through search excerpts | 2026 | https://dev.to/newsinsights26/ammonia-market-is-thriving-to-boom-in-the-forecast-year-2026-2034-4kab | General media (repost; original report not read)
- 〔S23〕J. W. Erisman, M. A. Sutton, J. Galloway, Z. Klimont, W. Winiwarter | "How a century of ammonia synthesis changed the world" | Nature Geoscience 1, 636–639 (2008) | https://www.nature.com/articles/ngeo325 | Not checked: redirected to a login page; neither full text nor abstract could be read. Known only as cited in 〔S18〕.
- 〔S24〕Vaclav Smil | Enriching the Earth: Fritz Haber, Carl Bosch, and the Transformation of World Food Production | MIT Press, 2001 | Not checked: paid book, full text not obtained. Known only as cited in 〔S18〕.
- 〔S25〕IEA | Ammonia Technology Roadmap: Towards more sustainable nitrogen fertiliser production (2021), Executive summary and Box 2.2 (pp. 71–72) | https://www.iea.org/reports/ammonia-technology-roadmap | International-agency report (facts and figures cited only; no charts reproduced)
- 〔S29〕Norwegian patent NO 12961 (Birkeland, 1903), original document | Not checked: four forms of the number returned nothing from EPO OPS on November 2, 2026, and Google Patents has no record. The number is known only through 〔S10〕; family documents are in 〔S41〕.
- 〔S30〕Fortune Business Insights ammonia market report, original page | Not checked: original page not found; only the reposts in 〔S22〕 were read.
- 〔S31〕Google Patents Public Data (BigQuery public dataset
patents-public-data.patents.publications) | Queried November 2, 2026 | Primary source (patent bibliographic dataset) - 〔S34〕Ammonia Energy Association | Low-Emission Ammonia Data (LEAD) description page | Read November 2, 2026 | https://ammoniaenergy.org/lead | General media (industry association)
- 〔S35〕IRENA | Renewable Power Generation Costs in 2024 | 2025 | ISBN 978-92-9260-669-5 | Table S1 (p. 15) | https://www.irena.org/Publications/2025/Jun/Renewable-Power-Generation-Costs-in-2024 | International-agency report
- 〔S36〕Lawrence Berkeley National Laboratory | Utility-Scale Solar, 2026 Data Update (Seel, Mulvaney Kemp et al., October 2026), data file, sheet "LCOE Trend (PV only)" | https://emp.lbl.gov/utility-scale-solar | U.S. national laboratory data
- 〔S37〕U.S. Geological Survey | Nitrogen (Fixed)—Ammonia Statistics, Data Series 140 (last modified January 9, 2024; compiled by C.A. DiFrancesco, D.A. Kramer, L.E. Apodaca) | https://www.usgs.gov/media/files/nitrogen-historical-statistics-data-series-140 | Primary source (government statistics; U.S. public domain)
- 〔S38〕U.S. Army Ordnance Department & U.S. Department of Agriculture | Report on the Fixation and Utilization of Nitrogen | Washington: Government Printing Office, 1922 | Table 17, "World production of nitrogen," printed p. 50 | Scan: https://archive.org/download/reportonfixatio01agrigoog/page/n68.jpg | Primary source (government report)
- 〔S39〕U.S. Department of Commerce, Bureau of Foreign and Domestic Commerce | Foreign Commerce Weekly, Vol. 8, No. 10, September 5, 1942 | p. 5, "TABLE 1.—World Production of Inorganic Nitrogen [Nitrogen content, tons of 2,000 pounds]" | Scan: https://archive.org/download/sim_international-commerce_1942-09-05_8_10/page/n4.jpg | Primary source (U.S. government publication; public domain)
- 〔S40〕U.S. Bureau of Mines | Minerals Yearbook 1952, Vol. I, "Nitrogen Compounds," Table 5 (p. 785; fiscal years ended June 30, 1951–53; metric tons of contained nitrogen; fertilizer N only, excluding the U.S.S.R.); Minerals Yearbook 1963, Vol. I, "Nitrogen," Table 6 (p. 864; years ended June 30; thousand short tons of contained nitrogen; all nitrogen compounds) | Scans: https://archive.org/download/pub_usgov-minerals-yearbook_1952_1/page/n826.jpg ; https://archive.org/download/pub_usgov-minerals-yearbook_1963_1/page/n871.jpg | Primary source (government statistics; U.S. public domain)
- 〔S41〕EPO OPS bibliographic data | FR 335,692 A (published February 5, 1904; applicants S. Eyde, Kristian Birkeland; priority NO February 20, 1903; Procédé et dispositif pour la production de réactions chimiques intenses dans les combinaisons gazeuses ou les mélanges gazeux); US 772,862 A (issued October 18, 1904; Kristian Birkeland; Process of electrically treating gases) | https://worldwide.espacenet.com/patent/search?q=pn%3DFR335692A ; https://patents.google.com/patent/US772862A | Queried November 2, 2026 | Primary source (patent bibliography)


